Custom dashboards and systems for businesses that live in spreadsheets.
Putting spreadsheets together to know how much you sold or who needs a follow-up takes time. I build a dashboard with the numbers you choose, such as sales and pending follow-ups, or a system for your team to record and track the work.
When a dashboard helps
- To know how much you sold this month, someone puts several spreadsheets together.
- The dashboard shows the total right away, read from the spreadsheets you already use, if they allow it.
- Nobody is quite sure who is waiting for a follow-up.
- The dashboard lists who is waiting for a follow-up and since when.
- The team tracks the work in spreadsheets only one person understands.
- A system for the team to record and track the work, in the browser.
What a clinic's dashboard could look like
Week of September 22 to 26
- Appointments
- 64
- No-shows
- 7
- New patients
- 12
- Pending follow-ups
- 9
Appointments per week
515855605764
This week
Today's schedule
- 08:00Ana PaulaConfirmed
- 09:30BrunoConfirmed
- 11:00CecíliaWaiting
- 14:00DiegoReschedule
How new patients found the clinic
- Google5
- Referral4
- Instagram3
What you get
- A dashboard with the numbers you choose, read from the spreadsheets or system you already use, if they allow it.
- Access in the browser, on computer and phone.
- If a dashboard isn't enough, a system for your team to record and track the work.
Simora
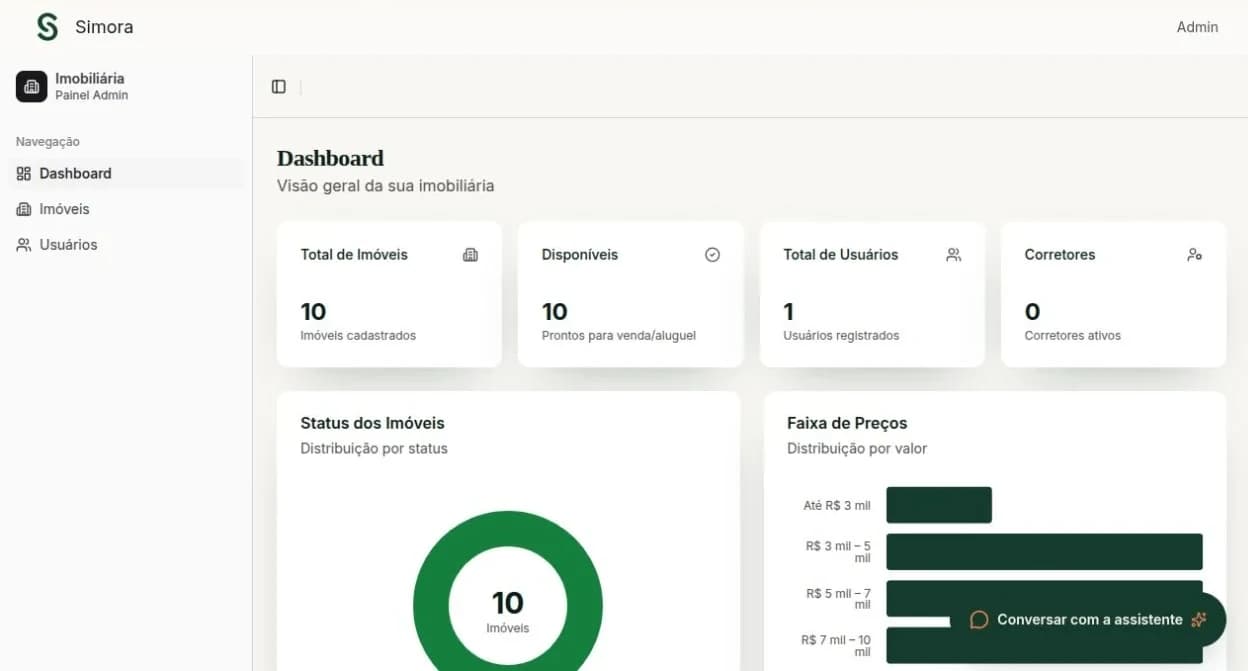
I built the first version of a property system for a client, with property listings, a dashboard and an AI chat. Then I set up a demonstration copy, which is the one shown here.
See how I built itTalk to me about the numbers you want to follow.
I also do
- Automations and AI assistant
So requests reach the spreadsheet without anyone copying them.
- Websites
Your business website, built and looked after once it's online.
